How to Size Your US Market Opportunity Using Official Data

Before you invest in a US launch, you need a realistic view of how big the opportunity is. Many sellers rely on a single tool's sales estimate or a competitor's review count. A better approach combines official market data with marketplace signals, from the top down and the bottom up. This guide shows how, starting with the US government's own e-commerce figures.
Start with the official big picture
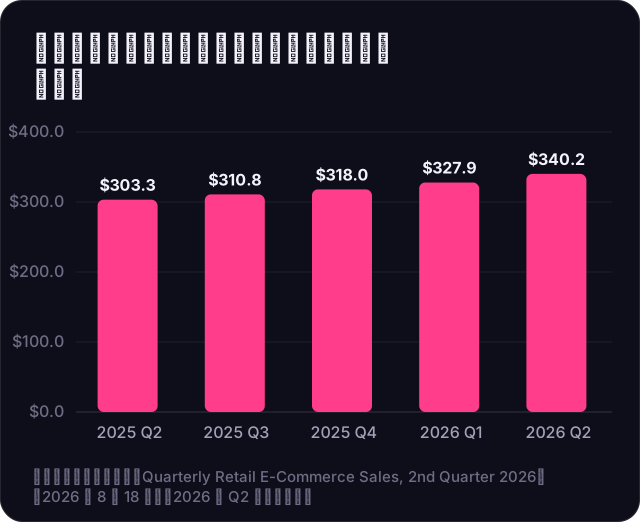
The U.S. Census Bureau's quarterly report (released August 18, 2026) estimates US retail e-commerce sales of $340.2 billion in the second quarter of 2026, seasonally adjusted, up 12.2% from a year earlier, while total retail sales grew 6.7%. E-commerce accounted for 17.1% of total retail sales.
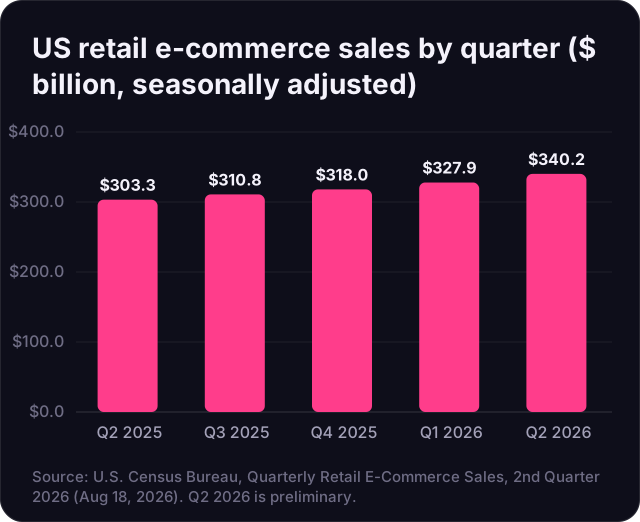
| Quarter (adjusted) | E-commerce share of retail | E-commerce growth vs a year earlier |
|---|---|---|
| Q2 2025 | 16.3% | +5.0% |
| Q3 2025 | 16.4% | +5.3% |
| Q4 2025 | 16.7% | +5.9% |
| Q1 2026 | 17.0% | +10.1% |
| Q2 2026 (preliminary) | 17.1% | +12.2% |
Source: U.S. Census Bureau, Table 1, Aug 18, 2026. The next release, for Q3 2026, is scheduled for November 19, 2026. Note that Census figures cover employer retail firms and are not adjusted for price changes.
Two things stand out. First, e-commerce grew almost twice as fast as total retail in Q2 2026 (12.2% vs 6.7%). Second, seasonality is strong: on a not-seasonally-adjusted basis, Census puts e-commerce at 18.3% of retail sales in Q4 2025 ($365.2 billion), compared with 15.8% in Q3 2025. The holiday quarter is where online sales concentrate.
Step 1: narrow from the market to your category
The national total tells you the market is large and growing, but you need a category view. Useful steps:
- Use the Census Bureau's annual retail and e-commerce data by kind of business for broad category sizes (see the Census e-commerce page).
- Check industry reports and trade associations for your specific category.
- Note whether your category sells mainly through marketplaces, brand websites or physical stores; this changes which channel to start with.
Step 2: measure demand bottom-up
- Search demand. Use marketplace search tools (such as Amazon's Product Opportunity Explorer in Seller Central) and keyword tools to see monthly search volume for your main keywords.
- Competitor sales signals. Look at best-seller ranks, review counts and review growth for the top 20 products. Treat third-party sales estimates as rough ranges.
- Price bands. Map where most sales happen by price; a crowded $15–$25 band needs a different plan from an open $60+ band.
- Seasonality. Check how demand changes over the year; many categories earn a large share of revenue in Q4.
Step 3: turn it into a sales target
Multiply realistic monthly units by your price for each channel, then subtract referral fees, fulfillment, ads and returns to see if the target is profitable. Start with a conservative share of the demand you measured; new brands rarely capture top-seller volumes in the first months.
Tip: Build three scenarios (conservative, base, strong) and order inventory for the conservative case, with a reorder plan ready if sales beat it.
Common mistakes
- Using the national e-commerce total as if it were your market.
- Trusting one tool's sales estimate without cross-checking.
- Ignoring seasonality and planning a launch just after a category's peak.
- Forgetting that growth figures from Census are not adjusted for inflation.
- Sizing the market but not the competition: a large market with entrenched leaders can be harder than a smaller, open niche.
A simple worksheet
- Write down the top 10 keywords and their monthly search volume.
- List the top 20 competitors with price, rating, reviews and estimated sales range.
- Mark the price band and features where you can be different.
- Estimate conservative, base and strong monthly units.
- Calculate profit per unit after all fees and ad costs, and check that the base case still makes money.
Ready to prepare a launch? Read our US market entry checklist.
How Atronia Innovations helps
With 12+ years of experience and offices in Los Angeles and Shenzhen, we help Chinese brands size US demand, choose the right first channel and plan launch inventory. See our Brand Accelerator or talk to our team.