September 2026 Retail Sales: Nonstore Up 8.2% as Spending Holds Up
US shoppers kept spending in September, and online and other nonstore retailers kept growing faster than retail overall. On October 15, 2026, the US Census Bureau reported advance retail and food services sales of $745.0 billion for September, up 0.8% from August and 6.3% from a year earlier. Nonstore retailers, the category that includes e-commerce, were up 8.2% year over year. Here is what the numbers say going into the holiday quarter.
The headline numbers
From the Census Bureau's Advance Monthly Sales for Retail and Food Services, September 2026 (seasonally adjusted, not adjusted for prices):
| Measure | September 2026 | vs August 2026 | vs September 2025 |
|---|---|---|---|
| Total retail & food services | $745.0 billion | +0.8% (±0.4%) | +6.3% (±0.5%) |
| Excluding autos & gasoline | $537.2 billion | +0.2% (not statistically significant) | +5.0% |
| Nonstore retailers | $124.3 billion | +0.3% | +8.2% |
| Gasoline stations | $68.0 billion | +6.4% | +28.1% |
The Census Bureau also revised August's monthly gain up to 1.3% from 1.1%. For the July–September quarter, total sales were up 5.5% from a year earlier and nonstore sales were up 7.5%. Not adjusted for seasonality, nonstore retailers sold $1.046 trillion in the first nine months of 2026, up 8.0% from the same period of 2025.
Gasoline was a big part of the monthly gain. Reuters, in a report carried by The Detroit News (Oct 15, 2026), said sales beat expectations in September "on higher gasoline prices." The Census data show why: gasoline station sales jumped 6.4% in the month, while sales excluding autos and gas rose just 0.2%, a change the Census Bureau says is not statistically different from zero.
Which categories grew
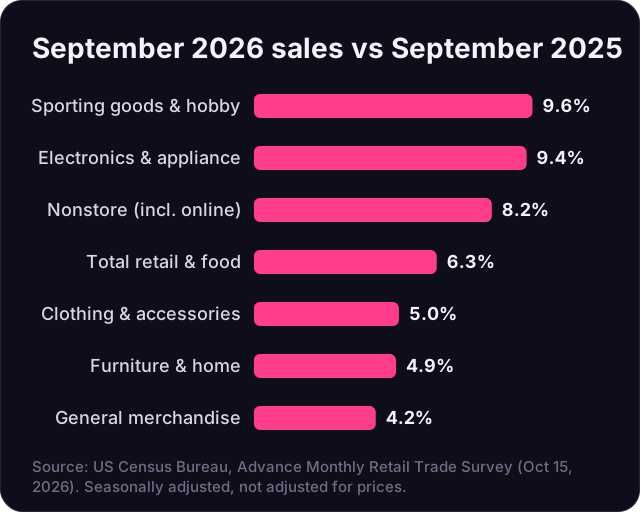
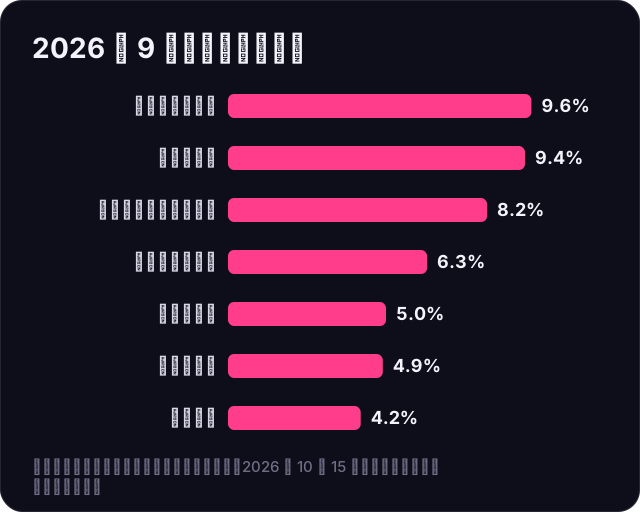
Sporting goods and hobby stores, electronics and appliance stores, and nonstore retailers grew fastest among the major categories. General merchandise stores, which include warehouse clubs and supercenters, grew 4.2%, and health and personal care stores fell 1.2%. Note that "nonstore retailers" includes online sellers and mail order but also other businesses without stores, so it is a close but not exact proxy for e-commerce. The narrower "electronic shopping and mail-order houses" line is not available in the advance report for September; in August it was $116.7 billion, seasonally adjusted.
A second read: the CNBC/NRF Retail Monitor
The CNBC/NRF Retail Monitor, which uses card transaction data rather than a survey, was released on October 8. It put September core retail sales (excluding autos, gas and restaurants) at $453.1 billion, up 0.27% from August and 3.73% from a year earlier. The two measures differ in scope and method, but both point to continued, moderate growth outside gasoline.
What it means for sellers (our analysis)
Online keeps taking share. With nonstore sales up 8.2% against 6.3% for all retail and food services, and 5.0% excluding autos and gas, the shift to online buying continued through September. That supports planning for a strong online holiday season; Adobe had forecast US online spending of $95.8 billion for October alone, up 8% year over year, according to MediaPost (Oct 5, 2026).
Underlying demand is steady, not booming. Excluding autos and gas, monthly growth was flat in statistical terms. Price-sensitive shoppers will compare deals, as Prime Big Deal Days showed; see our Prime Big Deal Days results.
Category matters. Electronics and sporting goods/hobby categories showed the strongest growth. If you sell in these areas, make sure inventory and ad budgets can keep up through December.
Watch costs as well as sales. Higher gasoline prices also feed into carrier fuel surcharges, which change weekly. Recheck your shipping cost per order heading into peak.
Checklist for Q4
- Compare your September year-over-year growth with the 8.2% nonstore benchmark.
- Review inventory cover for top SKUs through mid-December.
- Recheck margins after fuel surcharges and peak fees.
- Plan deals with a clear discount floor per SKU.
- Note the next Census release date: November 17, 2026 (October data).
How Atronia Innovations can help
We help brands and factories plan Q4 on Amazon, Walmart and TikTok Shop, from forecasting and inventory to ads and shipping. Talk to our team about your holiday plan.
Sources
- US Census Bureau — Advance Monthly Sales for Retail and Food Services, September 2026 (Oct 15, 2026)
- NRF — CNBC/NRF Retail Monitor, September 2026 (Oct 8, 2026)
- The Detroit News (Reuters) — US retail sales beat expectations in September on higher gasoline prices (Oct 15, 2026)
- MediaPost — Report: Amazon Prime Big Deal Days to reach $9.9B (Oct 5, 2026)