Census Q3 2026: US E-Commerce Hits $347.3B and 17.9% of Retail

Online shopping took a bigger slice of US retail again in the third quarter. On November 19, 2026, the US Census Bureau reported that retail e-commerce sales reached $347.3 billion in Q3 2026, up 10.4% from a year earlier and equal to 17.9% of all retail sales. Growth slowed from the second quarter, but online is still growing almost twice as fast as retail overall.
The headline numbers
According to the Census Bureau's Q3 2026 Quarterly Retail E-Commerce Sales report (seasonally adjusted, not adjusted for price changes):
- E-commerce sales: $347.3 billion, up 1.6% (±0.4%) from Q2 2026 and up 10.4% (±0.9%) from Q3 2025.
- Total retail sales: $1,941.9 billion, up 1.1% from Q2 and 5.6% from a year earlier.
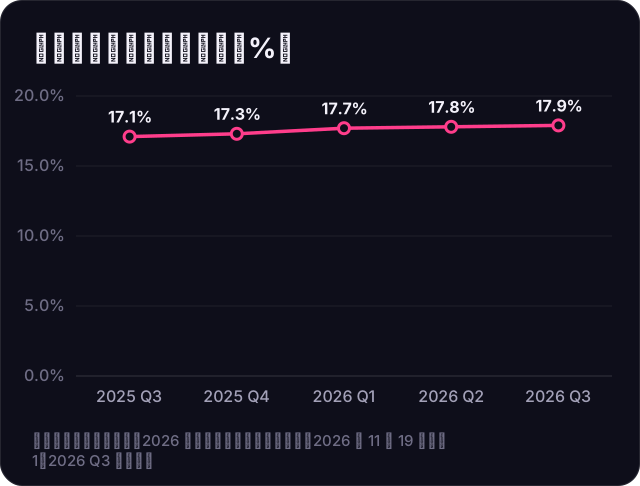
- E-commerce share: 17.9% of total retail sales, up from 17.8% in Q2 and 17.1% a year earlier.
- Revisions: Census revised earlier quarters using its annual survey. Q2 2026 e-commerce is now $341.7 billion, with year-over-year growth of 11.2%.
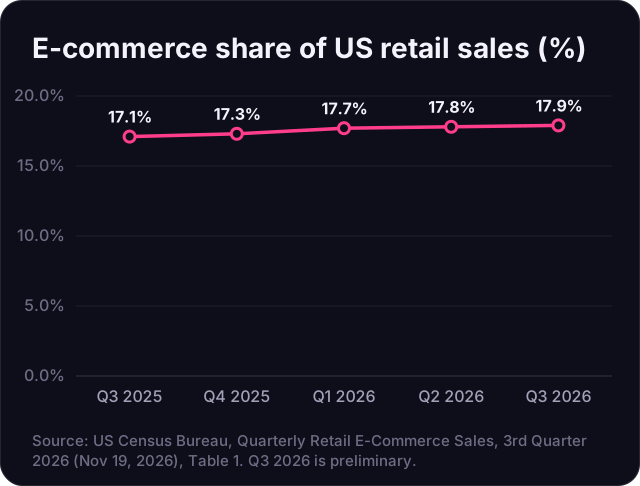
Breitbart (Nov 19) reported that the 17.9% share is the highest since Census began tracking it in 1999, and that the 1.6% quarterly gain was the smallest since Q2 2025. PYMNTS (Nov 20) noted that e-commerce took "nearly 18 cents of every U.S. retail dollar" and accounted for almost a third of the increase in retail spending from a year earlier.
Five quarters of data
| Quarter | E-commerce sales | Total retail sales | E-commerce share | E-commerce YoY |
|---|---|---|---|---|
| Q3 2025 | $314.5B | $1,839.4B | 17.1% | +5.4% |
| Q4 2025 | $320.0B | $1,850.8B | 17.3% | +5.0% |
| Q1 2026 | $329.6B | $1,867.2B | 17.7% | +8.5% |
| Q2 2026 | $341.7B | $1,919.9B | 17.8% | +11.2% |
| Q3 2026 (preliminary) | $347.3B | $1,941.9B | 17.9% | +10.4% |
Source: Census Bureau, Table 1, Nov 19, 2026 (revised series).
Our check of the "almost a third" figure from Table 1: retail sales grew by $102.4 billion year over year, and e-commerce grew by $32.8 billion, or about 32% of the increase (Calculation in millions: 347,322 − 314,500 = 32,822; 1,941,858 − 1,839,422 = 102,436). Retail outside e-commerce grew about 4.6%, in line with PYMNTS's figure.
The holiday pattern in unadjusted data
The seasonally adjusted series smooths out the holidays. The not-adjusted figures in the same report show how strong Q4 is for online sellers: in Q4 2025, unadjusted e-commerce sales were $365.4 billion, or 18.9% of retail, up 20.1% from Q3 2025. In Q1 2026 they fell 17.3% quarter over quarter to $302.1 billion. For Q3 2026, unadjusted e-commerce sales were $335.7 billion, or 17.2% of retail. If the usual pattern holds, Q4 is when your annual share of sales is decided, and January is when demand drops sharply, so plan cash and inventory for both.
What it means for sellers (our analysis)
- Online keeps gaining share, slowly. The share rose 0.8 points in a year. That is steady, not explosive, so growth will come more from winning share within channels than from the market lifting everyone.
- Double-digit growth heading into Q4. A 10.4% year-over-year pace going into the holidays supports a solid peak, in line with the NRF holiday forecast. Plan inventory on your own sell-through data, not the headline.
- Use the official series for planning. Census numbers are preliminary and get revised. Use them for direction, and see our guide on how to size your US market with official data.
- Monthly data comes first. For a faster read, the monthly nonstore retailers figure (see our September retail sales report) arrives weeks before the quarterly report.
What to do with this
- Compare your own Q3 year-over-year growth with the 10.4% market rate. Below it means you are losing share.
- Check which channels (Amazon, Walmart, TikTok Shop, your own site) drove your growth.
- Set Q1 2027 budgets assuming continued online share gains, but stress-test for slower growth.
- Mark February 19, 2027, when Census releases Q4 2026 data.
How Atronia Innovations helps
We help Chinese factories and US brands turn market data into channel plans across Amazon, Walmart and TikTok Shop, so you grow faster than the market. See our pricing or talk to us.
Sources
- US Census Bureau — Quarterly Retail E-Commerce Sales, 3rd Quarter 2026 (Nov 19, 2026)
- US Census Bureau — Quarterly Retail E-Commerce Sales data page
- PYMNTS — eCommerce Captures Nearly a Third of US Retail Sales Growth (Nov 20, 2026)
- Breitbart — Online Shopping Hits Record Share of Retail Sales (Nov 19, 2026)